China Charts #12 - Disappearing Data, US-China Tariffs, PMIs and Real Estate
When the narrative and numbers clash in China, the data quietly disappears.
China has a (low) shame-based culture. Through state propaganda and a chorus of overseas boosters, it tells grand stories about itself. But sometimes, the data contradicts the story. When that happens, the numbers don’t just get ignored - they get delayed, revised, or quietly removed. This pattern shows up across the Chinese economy, from official statistics to public company disclosures, including household tech names like Alibaba, Baidu, JD, and Pinduoduo.
Thank you for subscribing. Occasional forwarding is okay. If you are not a member, please sign up here.
"It is not necessary to change. Survival is not mandatory." - W. Edwards Deming
1. Disappearing Data
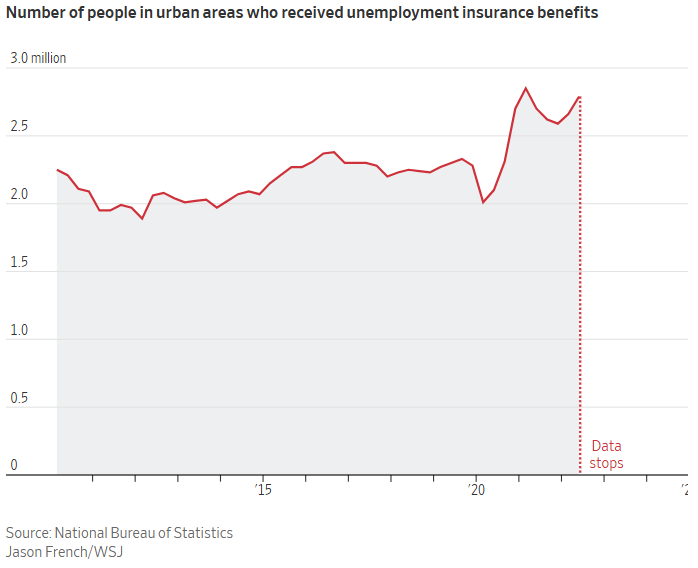
Charts in this section are sourced from WSJ’s How Bad Is China’s Economy? The Data Needed to Answer Is Vanishing. Many economists have theories about why China discontinues economic indicators. My view: the data stops when it no longer fits the story they want to tell.1
National land sales, by area and value
You can go take a look yourself at NBS’s data portal, click “Real Estate” then “Development and Sales of Real Estate”. Monthly data has stopped since Dec’2022.
Unemployment
Five months later, Beijing began releasing a new data series. The real youth jobless rate, it said, was 14.9%.
Officials said the new data series excluded nearly 62 million people who were studying full-time in universities, and so shouldn’t be counted as jobless. But that didn’t make sense to economists. Statistics typically count anyone actively looking for a job as unemployed, including full-time students.
Toll roads’ balance sheet, New stock market investors, Number cremated bodies, Soy sauce production
Demographics: Fertility rate
The true picture is likely worse than it appears. From the Wall Street Journal (emphasis added):
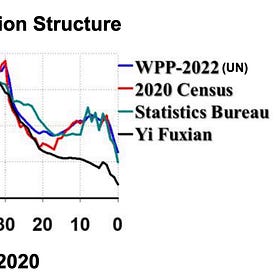
The country’s low fertility rate has become a major economic liability—and some data pointing to it is gone, too. In the mid-2000s, an economist named Yi Fuxian questioned the accuracy of China’s population data and argued that tuberculosis vaccinations were a better measure of population growth because every newborn in China is required to be vaccinated.
In 2020, 5.4 million such vaccines were administered, according to data compiled by the private Chinese think tank Forward Business and Intelligence. Chinese authorities said the country recorded 12.1 million births that year.
A year later, the National Institutes for Food and Drug Control discontinued the weekly data release of tuberculosis vaccines administered, along with other vaccine data.
In a country where statistics must serve the story, silence often speaks loudest.
(Sidenote: We previously cited Yi Fuxian’s work in a piece arguing China needs year-over-year disposable income growth of 9% or more to make real progress toward becoming consumer-driven and avoid the demographic wall.)
Data Leak, Demographics, and Consumption
The elements of today’s post — China’s 2020 census overcounting, the Shanghai data leak, and the consumption-led growth story — have been publicly available for a while now. We thought we’d tie the threads together and make their implications more explicit.
2. US-China Tariffs
The updated chart from Peterson Institute (PIIE) is something to behold.


