14 charts on China's economy, a mixed picture
Trying to make sense of things
There has been a flurry of pieces on how China’s economy is doing. Today we’re going to share some charts, some of our own and others’, and some commentary on what we see.
Chart 1: EPS growth down YoY in Q3, Tech up
The delay in an earnings turnaround underscores the challenges faced by companies despite Beijing’s efforts to boost growth. A worsening property crisis, dim income prospects and regulatory uncertainties continue to pressure businesses. The dire corporate performance suggests any stock market upswing spurred by government measures will be short-lived unless there are fundamental improvements in demand. - Bloomberg1
Tech EPS growth looks healthy. Sign of how bad the rest of the index is.
Chart 2: EPS Estimates back to earth
EPS estimates for the CSSP300 Index (S&P+CITIC 300 A-share companies) has roundtripped to beginning of year’s estimates. This shows 2023, 2024 and 2025 estimates all back to beginning of year levels.
Note the jump in April occurs like clockwork. The big Q1 data dump comes on April 18th and China holds a big Politburo meeting every April.
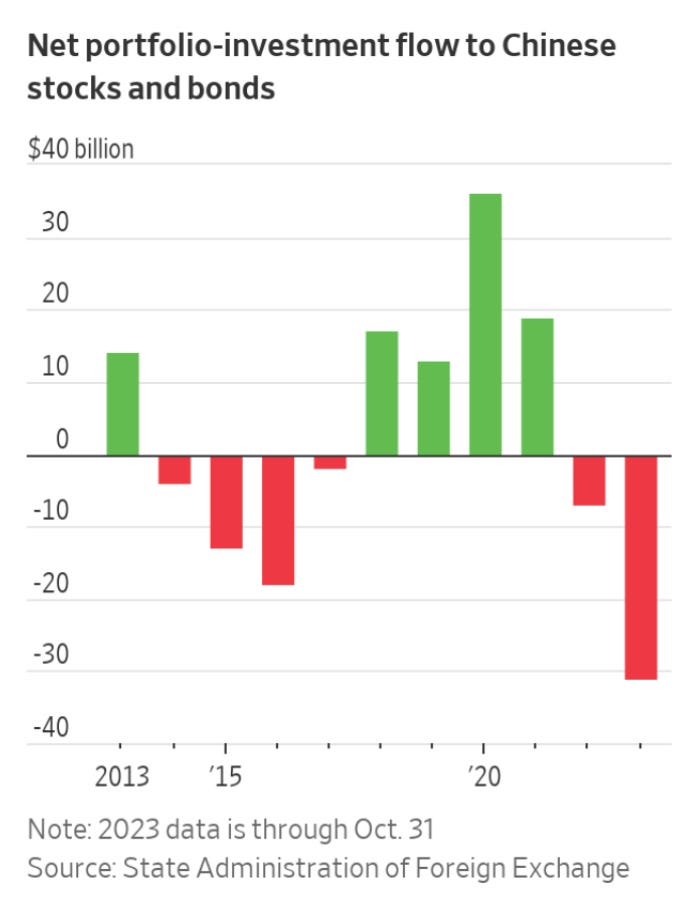
Chart 3: Net Portfolio-Investment Flows
The amount of money that institutional investors have in Chinese stocks and bonds has declined by more than $31 billion this year, through October, the biggest net outflow since China joined the World Trade Organization in 2001, official Chinese data show. - Lingling Wei, WSJ2
Chart 4: Airline passengers - Domestic recovered, international has not
Spike in July + August is seasonal norm, so we don’t think international passenger trend is broken yet, though it is likely to remain muted through western holiday season. Positive to see domestic passengers so strong during summer months.
Turning to Real Estate


