
THE BRIEF: July CPI release- persistent deflation?, healthcare gets a probe, LGFV debt restructuring
Trying to make sense of things
*This is a premium-only post. Thanks for being a subscriber, it means a lot.
*Apologies for missing last week (illness in family).
Key Message:
Last week, China’s headline CPI came in at negative 0.3% year-over-year, which appears to be deflation, but Core CPI came in positive 0.8% (excludes food and energy). We dig into the numbers. We expect food deflation to moderate in Q4. Energy deflation should end soon, as gas prices are on uptrend and globally oil demand remains high.
"There is always a disposition in people's minds to think that existing conditions will be permanent. When the market is down and dull, it is hard to make people believe that this is the prelude to a period of activity and advance. When the prices are up and the country is prosperous, it is always said that while preceding booms have not lasted, there are circumstances connected with this one which make it unlike predecessors and give assurance of permanency. The one fact pertaining to all conditions is that they will change." - Charles H. Dow, 1900
Contents
I. July CPI release
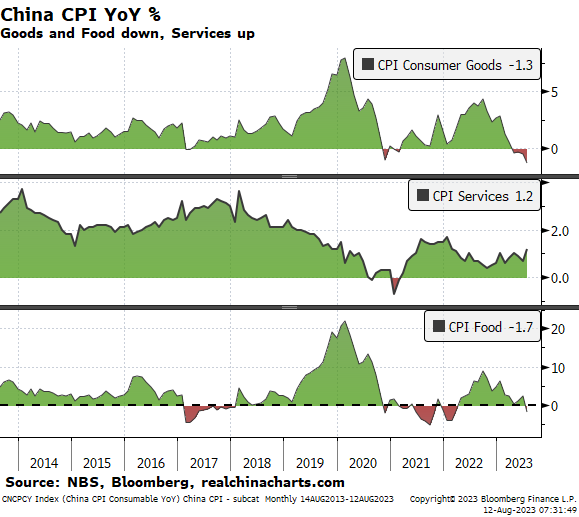
Headline CPI came in at -0.3%, dragged down by Food (-1.7%) and Goods (-1.3%), offset by rising Services (+1.2%).
Food and energy’s impact was high, evidenced by Core CPI reading positive 0.8% for the month YoY. We explore more below.

Quick note on weightings: China’s stats bureau doesn’t provide any. 😠 But some estimates have been made, such as the following chart from David Qu (Bloomberg Intelligence):

Headline categories were mixed. CPI Services came in +1.2%, still in inflation, though much lower than pre-Covid levels. The travel subcategory came in +13.1% in July, the highest increase since February 2018. This is a bright spot in the economy. On the ground, we notice many people are traveling this summer.
Services is the least volatile of the three headline categories, note the y-axis ranges. Food is the most volatile, with consumer goods in the middle.
Digging into Food
China’s stats bureau breaks out some commodity categories as well. In the volatile food category, the biggest decliners were meats (-14%, mainly pork which was -26%), oils and fats -1.3%. These were offset by increases in mainly fresh fruit (5%).
Changes in pork prices, while the magnitude is much higher, correlate very highly with the food CPI.